Fortran debugging in OSx with visual studio code

Debug fortran code in OSx
I have recently switch to a macbook air from a lenovo pc, overall I am quite happy with the change, the macbook is a delight to use, you have the best of linux terminal and the best of windows user interface and programs e.g. office. Not to mention the long lasting battery, it almost seems an engineering miracle.
One of the programming languages I usually use is good old Fortran, so I wanted to keep using it in my Mac. So the first step was to install gfortran, this was dumb simple using Homebrew to install gcc which includes gfortran.
brew install gcc
Debugging with lldb (Fail)
Great so now I can compile fortran programs. but usually I end up needing to debug them, one of my favorites editors currently is Visual Studio Code, I think Microsoft is doing a great job with this piece of software, not to mention that is multiplatform. So after installing the fortran language extension I decided to move forward and add debugging capabilities. For that I decided to install the gdb plugin.
After installing it and gdb through Homebrew my first surprise was that gdb didn’t run properly on OSX, this was a little bit of negative point for my new Mac, the are several workarounds to make it work but are a little bit tedious and I my own opinion not very clear and a little bit hacky. Fortunately, there is another option besides gdb , that is lldb which is already installed in my Mac , please note that I have Xcode already installed so I do not know if it is part of the initial configuration or if it was installed with Xcode.
So lets try with lldb. In order to make the lldb functionality available in Visual Studio Code, you need to make lldb-mi available in your path, this can be achieved just creating a symbolic link to your /usr/bin folder.
ln -s /Applications/Xcode.app/Contents/Developer/usr/bin/lldb-mi /usr/local/bin/lldb-mi
Then using lldb-mi with the compiled fortan program in order to debug it seems to work well, you can use breakpoints and resume the program but you cannot see the variables so you only get some crippled debugging capabilities which are not enough.So far I have not been able to find a way to make lldb understand fortran variables, so I will get back to gdb.
Debugging with gdb
So if I want to go beyond the breakpoint functionality it seems that I will need to use gdb. So we will start installing it with the following comand.
brew install gdb
This will certantly install gdb and you can initiate it from the command line for example but so far it does not allow you to run the Fortran binary unless you use sudo, so we need to fix it. In order to use it I had to add the -p option in taskgated as described in stackoverflow
Now we can use gdb from the command line and run the program. So let’s move to Visual Studio Code.
First we are going to create a task to build the binary, this can be just a call to Make command but for this case I’m going to call directly gfortran. Just edit the file tasks.json inside the folder .vscode , and set the following configuration.
{
    "version": "0.1.0",
    "name": "buildTask",
    "command": "gfortran",
    "isShellCommand": true,
    // this is neccesary when called from the debug task
    "cwd": "${workspaceRoot}",
     "args": [
                "-o", "foo", "-g","-O0", "main.f90"
            ]
}
Then we are going to configure our debug configuration to use gdb and call the build right before with the “preLaunchTask” property.
{
    "version": "0.2.0",
    "preLaunchTask": "buildTask",
    "configurations": [
        {
            "name": "Debug",
            "type": "gdb",
            "request": "launch",
            "target": "./foo",
            "cwd": "${workspaceRoot}"
        }
    ]
}
With this configuration we can debug and see some variables, great! . However , there is still some pending functionalities, for instances arrays, pointers and other non basic types and structures are not properly displayed in the debugger variable area. In order to be able to see pointers in the watch area you need to write them with a leading asterisk , otherwise it will show some hex number, probably the memory address.
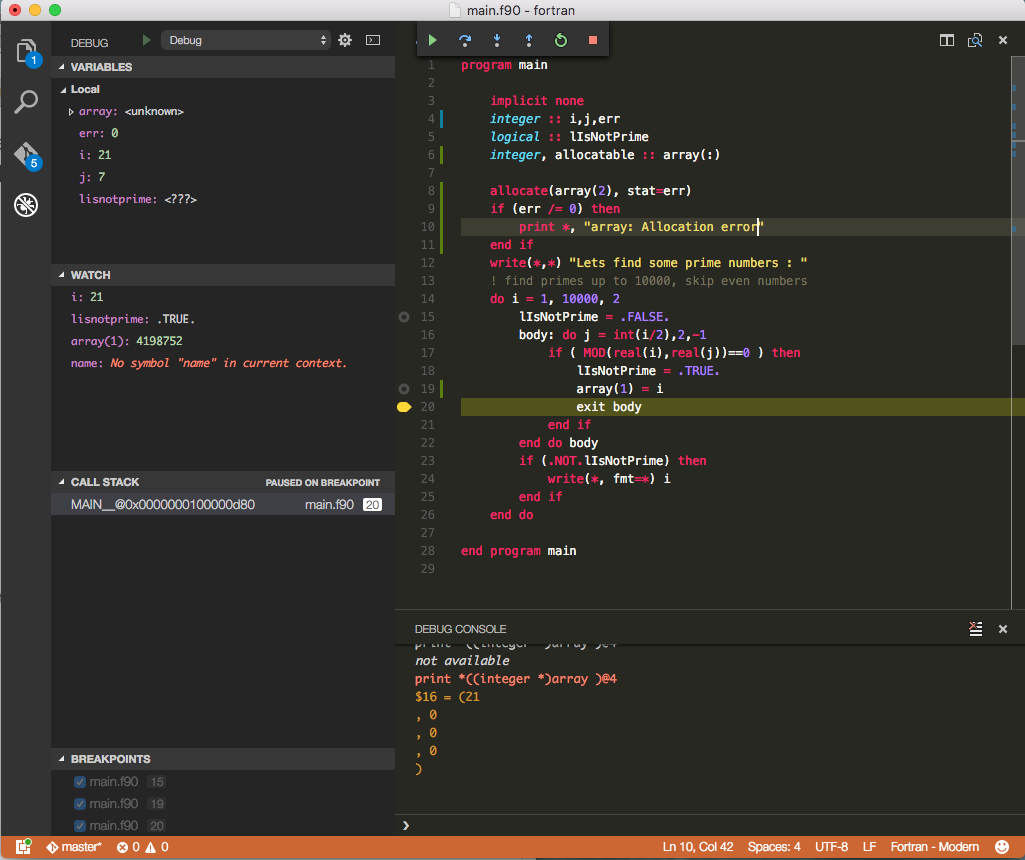
You can also access the array values using the debug console available. for example you can use the following commands:
To access the first item of the array
print *((integer *)array + 0)
To access the first 4 items of the array
print *((integer *)array + 0)@4
Obviously these commands are not really user-friendly but it is handy to be be able to access the debug console.
Although, the debug experience in other IDEs such as visual studio with intel fortran is much more pleasant, this is certainly useful and much more lightweight.